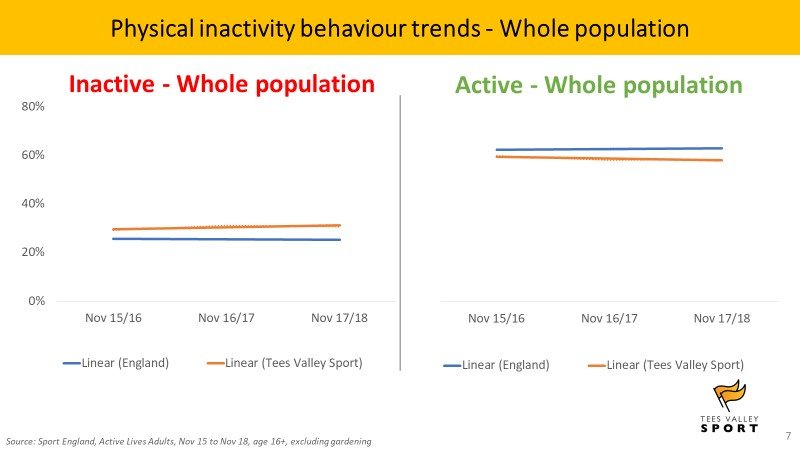
Inactive – Tees Valley Sport trend point suggests an annual increase (worsening) of 0.8pp. England has seen a decrease (improvement) of 0.3pp
Active – Tees Valley Sport trend point suggests an annual decrease (worsening) of 0.7pp. England has seen an increase (improvement) of 0.3pp
England’s changes are significant for both active and inactive between Nov15/16 – Nov 17/18 and also over the last 12 months (Nov 16/17 – Nov 17/18)
Tees Valley has seen no significant changes
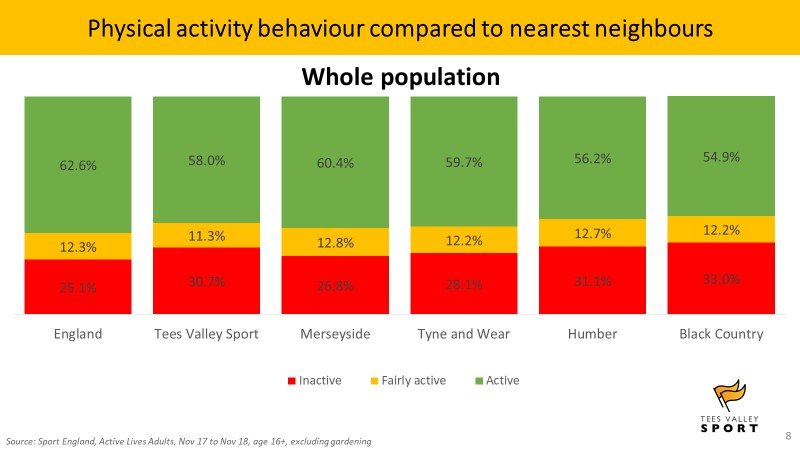
Inactive: Tees Valley Sport is ranked 3rd of 5 nearest neighbours and higher (worse) than England
Active: Tees Valley Sport is ranked 3rd of 5 nearest neighbours and lower (worse) than England
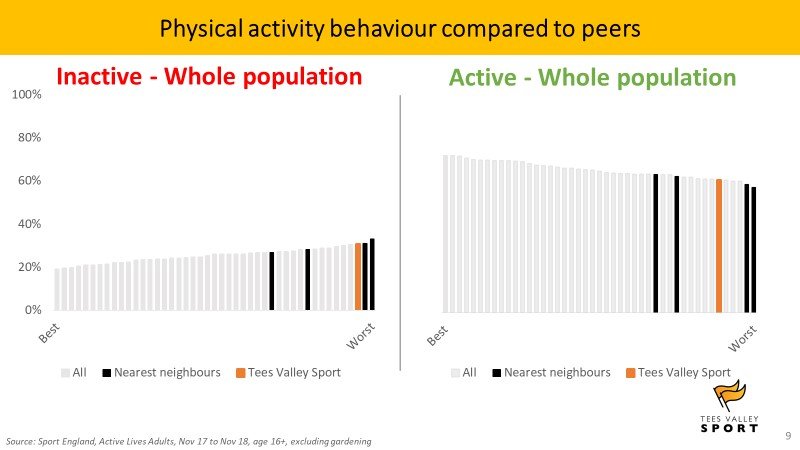
Left hand side is best performing Active Partnership for both inactive and active
Inactive
Active
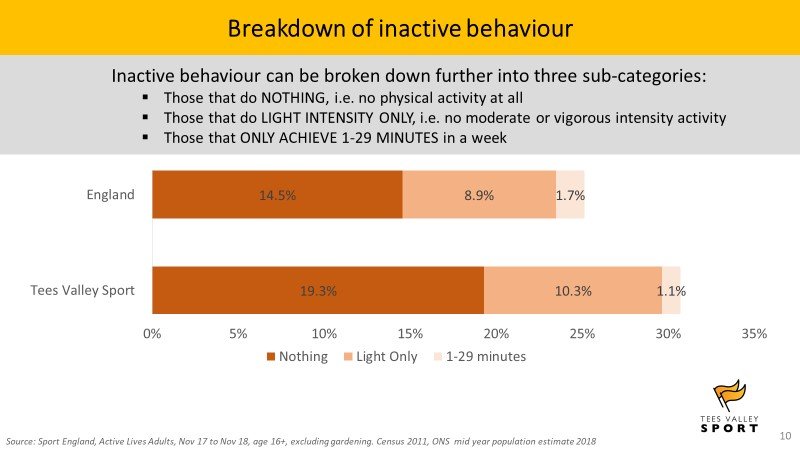
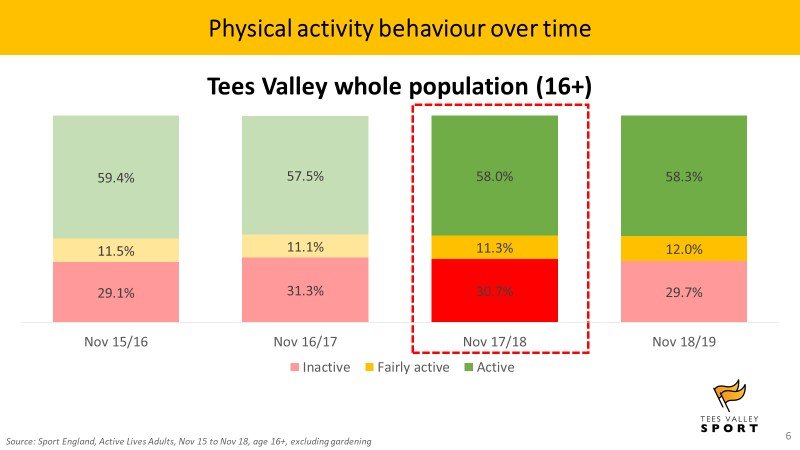
Approximately 167,000 of the population are inactive in Tees Valley (Nov 17/18). Of these 62,000 are doing “light only” or “1-29 minutes” per week but either missing the intensity or duration required to meet the CMO recommendations.
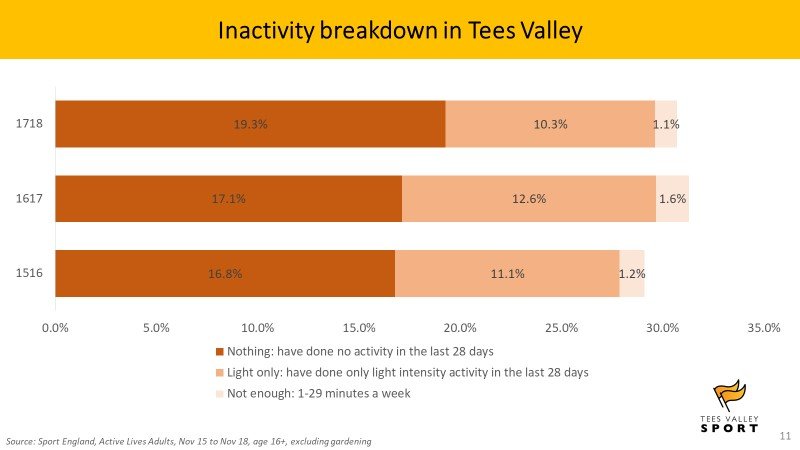
Proportion doing light only or not enough:
| Year | Inactive | Light only or not enough | Approximate population |
| 15 / 16 | 29.1% | 12.3% | 67,000 |
| 16 / 17 | 31.3% | 14.2% | 77,000 |
| 17 / 18 | 30.7% | 11.4% | 62,000 |